该项目的负责人是深圳大学管理学院杜宇程,项目成员有刘源、张春玲、王康、李翠。该项目主要围绕沿海三大经济区的碳配额初始分配进行展开,整合对比分析了多种数据包络分析法,最后构建的模型能专注于对碳排放效率的考虑,联合国政府间气候变化专门委员会(Intergovernmental Panel on Climate Change, IPCC)提出的计算方法,与国家发改委应对气候变化司提出的数据相结合,以符合中国实际国情,从而更精确地计算出化石燃料燃烧所产生的碳排放。沿海三大经济区是中国经济发展的重心,也是碳排放的大户。专注于这一区域的研究, 既有助于对区域本身碳市场的建立提供帮助,也能为全国范围内的区域研究提供借鉴。
本项目创新点:一是研究视角的创新,前人对初始碳配额的研究,对区域间的对比分析关注度不够。而沿海三大经济区是中国经济发展的重心,也是碳排放的大户。专注于这一区域的研究, 既有助于对区域本身碳市场的建立提供帮助,也能为全国范围内的区域研究提供借鉴。二是研究方法的创新,在计算配额分配的效率时,该项目整合对比分析了多种数据包络分析法,最后构建的模型能专注于对碳排放效率的考虑,而不是对全要素效率的考量。前人的研究多局限于后者。
项目的预期成果为完成一篇科技论文。实际成果发表了一篇SCI论文《Qin, Q., Liu, Y., Li, X., & Li, H. (2017). A multi-criteria decision analysis model for carbon emission quota allocation in China's east coastal areas: Efficiency and equity. Journal of Cleaner Production, 168, 410-419.》
本项目研究视角创新,切合实际,结构缜密。符合自主创新基金项目结项要求。
A multi-criteria decision analysis model for carbon emission quota allocation in China’s east coastal areas: efficiency and equity
Quande Qina,b,c, Yuan Liua, Xin Lia, Huanan Lib,c,d,*
a Department of Management Science, Shenzhen University, Shenzhen 518060, China
b Center for Energy & Environmental Policy Research, Beijing Institute of Technology, Beijing 100081, China
c School of Management and Economics, Beijing Institute of Technology, Beijing 100081, China
d Collaborative Innovation Center of Electric Vehicles in Beijing, Beijing 100081, China
【Abstract】 The allocation of carbon emission quotas is recognized as a fundamental and critical step towards the establishment of an effective nationwide carbon emissions trading (CET) market in China. This paper aims to examine the quota allocations pertaining to China’s east coastal areas. These regions are pioneers in reformation and the domestic heavy emitters. In this paper, a multi-criteria decision analysis model is proposed. This model is based on the principles of efficiency and equity. In order to reflect the true efficiency of carbon emissions, a weighted Russell direction distance model is employed. Three criteria, namely capacity, responsibility and potential, are used to evaluate the degrees of equity. Furthermore, different situations are set to evaluate the related indicators. The results indicate the following: (1) Industrial provinces have less carbon emission quota increments. (2) The Yangtze River Delta Economic Zone has notably improved energy efficiency, and future quota increments correspond with the zone’s current carbon emissions. (3) Circum-Bohai Sea Economic Zone will be a major buyer of carbon emission quotas, while Pan-Pearl River Delta Economic Zone currently receives surplus quota. (4) The overall allocation of quotas converts from uneven to even as a result of GDP growth. These results provide a reference for collaborative regional reductions in carbon emissions and for the construction of a CET market.
【Keywords】Carbon emission quotas; equity; efficiency; China’s east coastal areas; multi-criteria decision analysis
1. Introduction
Greenhouse gases (GHGs) are prime contributors to global warming. Carbon emissions resulting from the use of fossil fuels are estimated to reach 5 trillion tons, causing global average warming of 6.4 to 9.5 °C in the future years (Tokarska et al., 2016). The target of holding the increase in average global temperature below 2 °C has been recognized as crucial (UNFCCC, 2010). Nevertheless, China has become the world’s largest emitter of CO2, whose patterns of carbon emissions changed and - proportion of CO2 emissions induced by consumption grew rapidly (Mi et al., 2017a). Since Copenhagen Accord and Paris Agreement, China has pledged to reduce carbon intensity (CO2 emissions per unit of gross domestic product (GDP)) by 40 to 45% and by 60 to 65% in 2020 and 2030, respectively (with 2005 as the base year), with a peak of CO2 emissions by around 2030 or earlier (UNFCCC, 2015). This plan might have some important impacts on China’s society and economics (Mi et al., 2017b).
Carbon emission trading (CET) has been regarded as an effective tool for achieving such targets. Provincial carbon trading is expected to reduce carbon intensity by 19.79% to 25.24% in China, thus bringing about a significant Porter Hypothesis effect (Zhang et al., 2016). Since June 2013, China has carried out seven pilot CET markets in Beijing, Tianjin, Shanghai, Chongqing, Shenzhen, Guangdong, and Wuhan. A national CET market is expected to be in place by 2017. Xiong et al. (2017) compared China’s pilot CET market programs with international emission trading market, and proposed an analysis framework based on allowance allocation and allowance distribution. The initial allocation of CO2 emission permits is the first step towards establishing a CET market. However, the improper allocation of quotas has become commonplace (Liu et al., 2015). In China, relatively large regional imbalances exist in terms of economic performances, natural resources, and historical emissions (Yu et al., 2012). These imbalances may further hinder the fair and efficient allocation of carbon emission quotas.
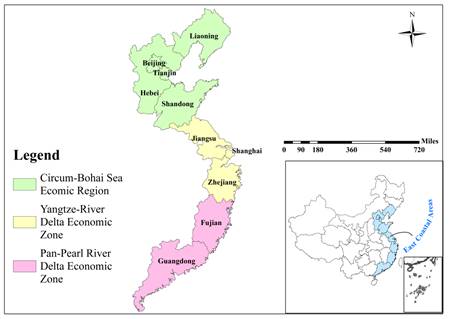
Fig. 1. Location of China’s east coastal areas
In this study, we examine the allocation of carbon emission quotas in China’s east coastal areas, which include seven provinces (Hebei, Liaoning, Jiangsu, Zhejiang, Fujian, Shandong and Guangdong) and three municipalities (Beijing, Tianjin, and Shanghai). In the east coastal areas, Beijing, Tianjin, Hebei, Liaoning, and Shandong comprise the Circum-Bohai Sea Economic Zone. The Yangtze River Delta Economic Zone includes Jiangsu, Shanghai, and Zhejiang. Fujian and Guangdong are located in the Pan-Pearl River Delta Economic Zone. The locations of these seven provinces and three municipalities are depicted in Fig. 1. Our motivations of exploring the east coastal areas are as follows: (1) China’s east coastal areas have been the vanguard of modernization, because of their advanced infrastructure, social system and agglomerations of talent. These characteristics make the east coastal areas the most likely to take the lead in establishing a CET market. (2) From Fig. 2, we can see that the east coastal areas are central to China’s efforts in economic development, as well as in reducing energy consumptions and carbon emissions (Gao et al., 2016). (3) A special analysis of China’s east coastal areas offers a reference for the regional study of carbon emission quota allocations and facilitates the construction of a national CET market.
Fig. 2. Carbon emissions, energy consumptions and GDP in China’s east coastal areas
Data source: Details of measurement in carbon emissions can be found in section 4.1; Energy consumptions and GDP are from NBSC (2006-2015b), NBSC (2006-2015a), respectively.
The most important part of a quota allocation system is the trade-off between efficiency and equity (Zhang & Hao, 2016). Efficiency relates to the allocation of limited carbon emission quotas in pursuit of a cost-effective outcome. Equity refers to the fair distribution of the carbon emission quotas throughout society, including balanced development in regional economics, historical emissions and etc. However, many previous studies only focus on either principals of equity or efficiency (representative literature shown in the next section), without quantitatively integrating indicators from these two aspects. And the features of our paper can be summarized as follows: (1) this paper focuses on the allocation of carbon emission quotas in China’s east coastal areas, due to their referential significance to China’s inland areas and national CET market. (2) A multi-criteria decision analysis model is proposed as a means to trade off efficiency and equity in the allocation of carbon emission quotas. This model constructs a comprehensive evaluation indicator that can be extended to relevant studies. (3) To measure the true efficiency of carbon emissions, we use a weighted Russell direction distance model by calculating the respective technical inefficiency in each input or output indicator (Zhou et al., 2012) rather than total factor energy efficiency (Zhang & Jiang, 2016). This method can reduce errors in efficiency measurement. (4) In order to accurately calculate the levels of carbon emissions, we combine the criteria published by IPCC (2006) and the adjusted data from the Department of Climate Change, National Development & Reform Commission of China (NDRC-DCC, 2014).
The remainder of this paper is organized as follows: Section 2 reviews the relevant literature pertaining to the allocation of CO2 emissions quotas. Estimation of carbon emissions is shown in sections 3. Section 4 explains the methods and data used. Our results and discussions appear in Section 5. Section 6 concludes our paper and offers policy implications.
2.Literature review
Equity and efficiency are the principles of governing the allocation of quotas and the first issue in determining emission permits. Ringius et al. (1998) deconstructed the general principles of equity into egalitarian, sovereign, horizontal, vertical, and polluter-pays equity. Further, Vaillancourt and Waaub (2004) proposed additional principles, including the right to emit, basic needs, historical accountability, ability to pay, comparable costs, willingness to pay, and merit. The criterion of merit as a measure of efficiency has also gained prominence among scholars (Zhang & Jiang, 2016). Thus far, some methods have been proposed to deal with carbon emission quota allocations based on the principles of equity and/or efficiency. Based on principles from Ringius et al. (1998), literature classification from Han et al. (2016), and literature reviews from Zhou and Wang (2016), we summarize the methods used for carbon emission quota allocation, shown in Table 1.
Table 1 Methods and principles of carbon emission quota allocations
Allocation methods |
Principle |
References |
Sovereignty |
Egalitarianism |
Vertical |
Polluter pays |
Merit (Efficiency) |
Others |
Traditional methods |
Grandfathering |
P |
|
|
|
|
|
Zetterberg et al. (2012), Schmidt and Heitzig (2014), Chang et al. (2017) |
Benchmarking |
|
|
|
|
P |
|
Sartor et al. (2014), Zhang et al. (2015), Chang et al. (2017) |
Auction |
|
|
|
|
P |
|
Burtraw and McCormack (2017), Tang et al. (2017) |
GDP per capita |
|
|
P |
|
|
|
Ciscar et al. (2013), Bai et al. (2014) |
Cumulative emissions |
|
|
|
P |
|
|
Pan et al. (2014), Raupach et al. (2014) |
Emissions per capita |
|
P |
|
|
|
|
Ekanayake et al. (2015), Apergis and Payne (2017) |
Composite indicators |
|
|
|
|
|
P |
Yi et al. (2011), Chen et al. (2016), Han et al. (2016) |
Optimization |
DEA |
|
|
|
|
P |
|
Wei et al. (2012), Wang et al. (2013), Miao et al. (2016) |
Nonlinear programming |
|
|
|
|
P |
|
Zhou et al. (2013), Wang et al. (2014), Liu et al. (2017) |
Game theory |
|
|
|
|
P |
P |
Zhang et al. (2014), Liao et al. (2015), Ren et al. (2015) |
Hybrid approaches |
|
|
|
|
|
P |
Yu et al. (2014), Zhang et al. (2014),, Zhao et al. (2017) |
Traditional methods for allocating carbon emission quotas are widely used,including grandfathering, benchmarking, auction, GDP per capita, cumulative emissions and emissions per capita. In terms of grandfathering, Zetterberg et al. (2012) evaluated grandfathering, auctioning, and benchmarking methods and discussed European and American schemes for the allocation of emission allowances. Schmidt and Heitzig (2014) also investigated whether or not grandfathering schemes prevented firms from relocating to countries with lower carbon prices. Recently, Chang et al. (2017) assessed the incentives of grandfathering and benchmarking methods on low carbon remanufacturing. As for benchmarking, Sartor et al. (2014) assessed benchmark-based allocations in the European Union Emissions Trade Scheme (EU ETS) Phase 3 and demonstrated that benchmarking reduces windfall gains and the risks associated with carbon leakage. Similarly, Zhang et al. (2015) suggested that enterprises concentrate more on how current decisions affect near-term profits under benchmarking. Apart from these studies, many researchers also focused on auction for its efficient allocation of resources. For example, Burtraw and McCormack (2017) explored how consignment auctions mitigating the obstructions of an efficient market. Besides, Tang et al. (2017) designed China’s carbon allowance auction from a multi-agent perspective.
Allocation based on GDP per capita was also treated as an effective way. For instance, Ciscar et al. (2013) analyzed the comparability of allocations across various countries according to GDP per capita, GHG emissions per GDP, recent GHG emission trends, and population growth. Another example is Bai et al. (2014), who used GDP per capita to calculate the allocation of carbon emission allowances among China’s provinces.
Instead of perspectives from economics, allocation based on emissions better reflects the principle of equity. This allocation mainly includes cumulative emissions (Pan et al., 2014;Raupach et al., 2014) and emissions per capita (Ekanayake et al., 2015; Apergis & Payne, 2017). Pan et al. (2014) investigated cumulative emissions per capita to simultaneously consider historical emissions and future needs. Raupach et al. (2014) proposed that worldwide regional and national per-capita carbon quotas should be based on the present distribution of cumulative emissions. As for emissions per capita, Ekanayake et al. (2015) considered egalitarian-based, emissions-based, and GDP-based allocation principles. Further, Apergis and Payne (2017) studied per capita carbon emissions across America through sector and fossil fuel source.
Alongside these traditional methods, composite indicators integrate different allocation principles, depending on the choice of indicators. Yi et al. (2011) constructed a comprehensive indicator system encompassing equity, responsibility, capability, and potential. Similarly, Han et al. (2016) studied equity indicators in the Beijing-Tianjin-Hebei region, integrating objective and subjective weighting methods. Chen et al. also (2016) built a carbon emissions reduction index which incorporated scale-related effects and carbon emissions allocation, and considered different carbon emissions standards in constructing the index. Apart from composite indicators, data envelopment analysis (DEA) and nonlinear programming are also popular optimization methods (Zhou & Wang, 2016), such as slacks-based measures (SBM) (Wei et al., 2012), zero-sum gains DEA (Miao et al., 2016; Wang et al., 2013) and nonlinear programming (Zhou et al., 2013; Wang et al., 2014; Liu & Lin, 2017). Besides, game theoretic approach is also treated as a good way in allocating permits, since it incorporates negotiations between entities to reach equilibrium in the allocation of carbon emissions. Zhang et al. (2014) allocated carbon reduction targets among regions by adopting the Shapley value method, and found that when utilizing the entropy method, the optimal allocation results might change significantly compared with the basic quotas. Similarly, through taking three power plants in Shanghai as examples, Liao et al. (2015) conducted benchmarking, grandfathering, and Shapley value simulations. On the other hand, by using Stackelberg game models under four different scenarios, Ren et al. (2015) allocated the product-related carbon emission abatement targets between the manufacturer and the retailer. Last but not least, hybrid approaches combined with diverse methods can effectively reflect principles of allocation. Yu et al. (2014) studied provincial allocation using an improved fuzzy cluster and Shapley value decomposition as the means to reveal factors underlying emissions growth. Zhang et al. (2014) combined information entropy, gravity model, and the Shapley value to investigate the degree of collaboration. And Zhao et al. (2017) examined the allocations the CO2 emissions to China's 41 industries/sectors under the constraint of carbon emission intensity in reaching the 2030 reduction target based on an integrated approach.
3 .Estimating carbon emissions
As for calculation carbon emissions, consumption-based accounting measures have been developed (Mi et al., 2016). Due to the incomplete data of anthropogenic CO2 emissions statistics in China, we employ the normalized approach recommended by the Intergovernmental Panel on Climate Change (IPCC) in the IPCC Guideline to assess China’s CO2 emissions. In addition, we utilize the adjusted data of carbon emission coefficients from NDRC-DCC (2014), which considers the specific differences of the fossil fuels used in China. Carbon dioxide emissions coefficients are shown in Table 2. Accordingly, carbon dioxide emissions can be calculated according to the following Eq. (1) as shown below Table 2.
Table 2 Main coefficients used in calculating carbon dioxide emissions
|
Raw Coal |
Cleaned Coal |
Other Washed Coal |
Briquettes |
Coke |
Crude Oil |
Gasoline |
Kerosene |
Diesel Oil |
Fuel Oil |
LPG |
Natural Gas |
Other Petroleum Products |
Net Calorific Value(TJ/103t) |
17.82 |
28.20 |
28.20 |
17.95 |
28.44 |
42.62 |
44.80 |
44.75 |
43.33 |
40.19 |
47.30 |
38.93 |
40.20 |
Carbon Content(t/TJ) |
27.28 |
25.80 |
25.80 |
25.80 |
29.41 |
20.00 |
18.90 |
19.60 |
20.17 |
21.09 |
17.20 |
15.32 |
20.00 |
Carbon Oxidation Rate |
0.92 |
1.00 |
1.00 |
0.90 |
0.93 |
0.98 |
0.98 |
0.99 |
0.98 |
0.99 |
1.00 |
0.99 |
1.00 |
 (1)
(1)
where i indicates different fossil fuels, including coal, gasoline, kerosene, diesel, fuel oil, and natural gas. Also,  and
and  , respectively, represent the total consumption of fuel
  , transformation factor, carbon oxidation factor, and carbon content of fuel . Data for
  are obtained from the energy balance tables (by region) in the NBSC (2006-2015b). In addition, the parameter
  is the ratio of the mass of one carbon atom to the mass of one carbon atom combined with two oxygen atoms.
4.Material and methods
4.1 Criteria selection and data source
As different indicators may incur various allocation results, it is important to choose some reasonable criteria, which should well reflect regional development in economics, environmental issues, emissions reduction potential and technology improvement and so on. Based on the principles of equity and efficiency, we use per capita GDP, historically accumulated CO2 emissions, and CO2 emissions per unit of industrial added value to represent an entity’s CO2 emissions reduction capability, responsibility, and potential (Yi et al., 2011). Besides, carbon emission efficiency was evaluated based on a weighted Russell directional distance model (WRDDM) (Zhou et al., 2012; Fujii et al., 2014). Details of these criteria are shown in Table 3.
Table 3 Criteria selection and interpretation of each criterion
Dimension |
Criterion |
Interpretation |
Capability |
Per capita GDP ( ) ) |
The richer the province is, the stronger their reduction capacity |
Responsibility |
Historically accumulated carbon emissions ( ) ) |
More emissions reduction responsibility will be borne by provinces with higher historically accumulated carbon emissions |
Potential |
CO2 emission per unit of industrial added value ( ) ) |
Provinces with higher industrial added value, will have more scope to reduce emissions |
Efficiency |
Carbon performance index (CPI) ( ) ) |
A larger CPI means better carbon performance and more quota increments can be allocated |
4.1.1 Indicators based on equity
To reflect the capability of carbon emissions reduction for each region, per capita GDP () is proposed. Provinces or municipalities with higher per capita GDP are better able to reform technology and thus achieve a low-carbon economy. This situation directly corresponds to the principle of ability to pay.
Another important principle is “polluter pays”, and according to this, historically accumulated carbon emissions () is put forward. Historically accumulated CO2 emissions from 2005 to 2014 is used to represent this indicator. Historically accumulated CO2 originates in the principle of historical responsibility—i.e., those who historically have emitted the most should shoulder a heavier reduction burden.
Third, to reflect the room for carbon emissions reduction, the criterion, CO2 emissions per unit of industrial added value () is proposed. Industrial sectors like electric power and heat power should undertake the largest carbon emission intensity reductions (Zhao et al., 2017). By improving production technologies and using clean energy, industrial sectors will have large carbon emission reduction potential. In other words, higher CO2 emissions per unit of industrial added value indicate greater room for carbon emissions reduction.
Specific data descriptions of these three above indicators are shown in section 4.1.3. And all the three indicators are inverse indicators. It means that the higher values of these indicators contribute to the lower increments in allocated quotas.
4.1.2 Indicator based on efficiency
We utilize a WRDDM to construct a carbon performance index (CPI), represented by . In this DEA model, capital stock, labor, and energy consumption act as proxies for inputs, with GDP as the desirable output, and CO2 emissions as the undesirable output. This model produces affirmative indicators, whereby the allocated increments in quotas track CPI growth.
As opposed to the total factor energy efficiency model (Zhang & Jiang, 2016), a WRDDM can effectively measure technical inefficiency, due to WRDDM’s advantages in incorporating the additional undesirable outputs, and respectively measuring the different efficiency values of each input or output indicator (Barros et al., 2012; Fujii et al., 2014). Applying this WRDDM model, we can accurately calculate the efficiency of carbon emissions measured by CPI (Zhou et al., 2012). The directional distance function seeks to decrease the inputs and undesirable output and increase the desirable outputs simultaneously. Combined with the characteristics of carbon quota allocation, we construct the model as follows:
 (2)
(2)
where  is the normalized weight vector related to the numbers of inputs and outputs;
  stands for the intensity variables used to shrink or expand the individual inputs and outputs, and
 denotes three input vectors, namely capital stock, labor and energy consumption. Desirable output and undesirable output are
  and
and  respectively. The vector
  determines the directions where inputs, desirable outputs and undesirable outputs are scaled. Correspondingly,
  represents the degree of individual inefficiency for inputs, desirable outputs and undesirable outputs.
Referring to Zhou et al. (2012), we set directional vector  and the normalized weighted vector
 . Assuming that
  and
and  are the optimal solutions to Eq. (2), we define the carbon performance index (CPI) as follows:
 (3)
(3)
In practice, CPI measures the ratio of target carbon intensity to actual carbon intensity, whose value lies in the interval  . A bigger CPI corresponds to better carbon performance, which in turn indicates that additional quota increments can be allocated.
4.1.3 Data source
The data source for each variable is described as follows (points (1)-(3) depicts indicators based on equity, (4)-(7) describes indicators based on efficiency):
Carbon emission reduction capacity: Average per capita GDP from 2005 to 2014 (in 2005 price). Data are from the NBSC (2006-2015a).
Carbon emission reduction responsibility: Historically accumulated CO2 emissions from 2005 to 2014 based on energy consumption data in the NBSC (2006-2015b) and methods provided by the IPCC (2006).
Carbon emission reduction potential: Average carbon emissions per unit of industrial added value, from 2005 to 2014 (NBSC, 2006-2015a). When calculating industrial added value, we use the producer price index to diminish changes in price, using 2005 as the base year.
Labor: Data relating to labor are from the statistical yearbook spanning 2006 to 2015, for different provinces and municipalities. The calculation of labor uses the average value between the beginning and end of an employment year.
Capital stock: Capital stock is estimated by the perpetual inventory method (Zhang et al., 2004), as follows:
 (4)
(4)
where  and
and  represent gross investment, depreciation rate, and capital stock for province at time
  , respectively. We select 1952 as the initial capital stock year.
Energy Consumption: These data are from NBSC (2006-2015b).
GDP: Here, GDP is expressed in terms of 2005 prices, and the data are from the NBSC (2006-2015a).
4.2 Multi-criteria decision analysis
4.2.1 Comprehensive indicator construction
Multi-criteria decision analysis (MCDA) is a popular means of analyzing multi-dimensional problems involving conflicting criteria and diverse data (Troldborg et al., 2014). These MCDA methods have effectively allocated CO2 emissions while integrating differing equity and efficiency criteria (Zhou & Wang, 2016). We choose the weighted-sum MCDA method, due to its simplicity and practicality (Wang et al., 2009). We begin as follows:
 (5)
(5)
where  represents the integrated indicators of ten studied provinces or municipalities, respectively.
  is the weight of
  .
.
4.2.2 Weighting method
To measure, entropy method is used due to its objectivity and practicability. The degree of disorder in a system can be described by information entropy, and the inequality of the system can be judged quantitatively. The information content negatively correlates with the degrees of uncertainty and entropy. Heavier weight is given to more discrete indicators. Assuming there are  samples and
  indicators, and the value of each indicator is
  . Steps in the entropy-weighting method can be summarized as follows:
Step 1: Data normalization. The extreme value method is used to normalize the data. Indicators are normalized either by Eq. (6) or Eq. (7). If increases of indicator values justify larger quotas, then those indicators will be positive, which can be normalized as:
 (6)
(6)
Otherwise, indicators will be negative if increases of their values justify fewer quotas, whose normalization formula is as follows:
 . (7)
. (7)
Combined with Eq. (6-7), we can calculate the proportion of  in the j-th indicator as:
 (8)
(8)
where  .
.
Step 2: Calculate the entropy value of the j-th index.
Information entropy shows the extent to which the criteria reflect the system information and the degree of each criterion’s uncertainty. The equation can be written as:
 . (9)
. (9)
If  , then we can stipulate that
  .
.
Step 3: Calculate the weight eigenvector:
 . (10)
where  denotes weights of indicator
  , which can be used in Eq. (5) to measure
  .
.
4.3 Allocation of carbon emission quotas
Combined with Eq. (5-10), the value of  can be calculated. Further, we define the proportion of allocated incremental quotas (PAIQ) in each province or municipality
  as follows:
 (11)
(11)
Carbon intensity ( ) in year is expressed as:
 (12)
(12)
where  is the quantity of regional CO2 emissions in year , and
  is the GDP in year , computed at 2005 prices. The allocation target is based on reducing carbon intensity by 40 to 45% (relative to 2005 levels) by 2020, and from 60 to 65% by 2030 (UNFCC, 2015). Considering the targets set for 2020 and 2030, we assume
  in 2020 and
  in 2030, and
  denotes the increments of regional carbon emission quota from 2014 to year t.
 (13)
(13)
 (14)
(14)
Basically, we assume that 2014’s CO2 quotas ( ) is equal to the actual amounts of carbon emissions in 2014. The carbon emission quotas of province or municipality in year
  are allocated as in Eq.(15):
 (15)
(15)
where  represents the carbon emissions of province or municipality in year , and
  means the increments in carbon quotas of from 2014 to year , which can be calculated as follows:
 (16)
(16)
5.Results and discussion
5.1 Results of carbon emission quota allocation at province level
The weights for each indicator are calculated by using the entropy method. Accordingly, the weights of capability, carbon emission efficiency, responsibility and potential are 0.2843, 0.2708, 0.2228 and 0.2221, respectively. Results of allocated carbon emission quotas are shown in Fig.3. In this figure, “2014’s CO2 quotas” is measured by the actual carbon emissions in 2014, while the item “2020’s CO2 quotas” and “2030’s CO2 quotas” denote the shares of allocated carbon emission quotas in 2020 and 2030, respectively. PAIQ is calculated by Eq. (11). The allocation results for 2020 and 2030 are calculated based on the requirement of the reduction target of per unit of GDP in 2020 and 2030, as announced by China’s government. Specifically, the reduction target is set to 40% by 2020 and 60% by 2030, compared with 2005’s levels. In addition, GDP growth is assumed to be 6%, which is compatible with China’s new and current normal economic development.

Fig.3. Percentage of allocated carbon emission quotas in east coastal areas.
According to Fig.3, China’s east coastal areas can be categorized into three groups, which in turn reflect the differences between the allocated incremental quotas and the 2014 CO2 emissions shares. The first group is comprised of those who accounted for a greater share of carbon emissions in previous years (Shandong, Hebei, and Jiangsu). As such, these provinces are allocated lesser increments. Therefore, these provinces will have smaller quota shares in 2020 and 2030 (compared to 2014). These provinces must shoulder a larger burden in terms of reducing emissions, by the way of both economic and industrial transitions. Conversely, the second group includes Fujian, Tianjin, and Beijing. These provinces’ increments in terms of carbon quotas shares far exceed their carbon emissions, allowing them to enjoy some quota surplus. Members of this group can sell their quotas on the CET market and further develop a low-carbon economy. Finally, members of the third group, whose quota increments match their carbon emissions, are Guangdong, Zhejiang, Liaoning, and Shanghai. These areas can attain an internal balance between quotas and emissions. The quota shares these provinces will have in 2020 and 2030 are almost the same as their carbon emission shares in 2014.
When we compare the carbon quota shares in 2020 with 2030, 2020’s quota share is found to be closer to 2014’s. This finding shows that, over time, provincial industrial structures and modes of economic development will change, and this is the primary requirement for meeting carbon intensity reduction targets.
5.2 Results of carbon emission quota allocations in three economic zones
The three economic zones covered by this study hold some common development trends, but they also have a number of different features. Evidences found across the three economic zones (Fig. 4) prove this point. During the period from 2005 to 2014, an overall trend was for the CO2 emissions per unit of industrial added value to decline, while per capita GDP and efficiency (CPI) tended to increase. This common trend shows the success of China’s strategy to achieve sustainable and high-efficiency development.
On the other hand, the same three economic zones also present diverse development modes. Fig.4 indicates the following three main differences. First, the Circum-Bohai Sea Economic Zone emits higher levels of CO2 emissions than the other two zones during the above-mentioned period, with little improvement in efficiency. This finding indicates that traditional industries remain the primary engine of economic development in this zone and also the region has extensive room for improvement. Secondly, the Yangtze River Delta Economic Zone shares the highest per capita GDP, and this zone’s efficiency has exceeded that of Circum-Bohai since 2012. This finding is a testament to the Yangtze River Delta Zone’s successful upgrading of technology. Thirdly, the Pan-Pearl River Delta Economic Zone has displayed the highest level of efficiency and the lowest CO2 emissions. This zone has benefitted from policy reforms and the introduction of advanced low-energy equipment and effective management.

Fig. 4. Value of four criteria in China’s three economic zones
Based on Table 4, we can ascertain three main implications in quota allocation. First, Yangtze River Delta Economic Zone can very nearly balance their emissions and quotas through internal trade-offs. The Yangtze River Delta Economic Zone’s allocated quota increment is proportional to its share of carbon emissions in 2014, which in turn reflects sustainable development coordinated to China’s national targets for reducing carbon intensity.
Secondly, the Circum-Bohai Sea Economic Zone may be a major buyer of quotas. This area has large CO2 emissions reduction potential, and this finding is consistent with the results reported by Qin et al. (2017) and Han et al. (2016). The Circum-Bohai Sea Economic Zone, a traditional industrial area, will remain the leading carbon emitter, even when the zone’s carbon quotas increments are being curbed.
Table 4 Percentage of allocated carbon emission quotas in three economic zones
District |
PAIQ |
2014’s CO2 quota |
2020’s CO2 quota |
2030’s CO2 quota |
Circum˗Bohai |
43.7% |
56.3% |
52.4% |
51.0% |
Yangtze River Delta |
28.0% |
27.4% |
27.6% |
27.7% |
Pan˗Pearl River Delta |
28.3% |
16.3% |
20.0% |
21.3% |
In contrast, Pan-Pearl River Delta Economic Zone, as a new star in the process of industrialization since China’s economic reform and opening up, has been allocated more incremental carbon quotas. This zone even has some quota surplus. One of the reasons for these results might be that clean energy has been largely imported. For example, Guangdong Province’s production structure was found to have become greener (Gao et al., 2016). The Pan-Pearl River Delta Economic Zone is an emerging area, with high potential for industrial development, low historically accumulated carbon emissions, and strong economic and manpower capabilities. This area displays relatively high level of energy efficiency which contributes to relatively greater quota increments.
5.3 Discussion based on different scenarios
5.3.1 Different integration methods
To further explore how changes in indicators affect the allocation of incremental quotas, we compare four scenarios, as follows: 1) indicators of equity and efficiency integrated by the entropy method; 2) equal weights of equity and efficiency; (3) considering equity only; (4) studying efficiency only. The results obtained with each of the four scenarios are shown in Fig. 5.
From Fig.5, it can be seen that many areas have consistent scores in both equity and efficiency. For example, Fujian and Guangdong perform well in both equity and efficiency, while Shandong and Hebei score low in both categories. Also, it can be found that most areas exhibit nearly unchanged scores in all four scenarios. Only Liaoning scores highest in terms of efficiency but low in equity, thereby earning this province a mid-range integrated score. Remaining districts (such as Beijing, Tianjin, Shanghai, Jiangsu and Zhejiang) achieve average score in all four scenarios.
Taking our observations a step further, situations of 1) equal weights and 2) indicators of equity only tend to have a more even result in terms of allocation. In both of these scenarios, no areas have a quota share of less than 7.2%. This finding might indicate that the principal of equity may help produce steady emissions allocations.
Fig.5 also reflects that three economic zones hold different internal structures in terms of quota allocation. The provinces in Circum-Bohai Economic Zone differ largely in their quota shares, especially in situations where only indicators of efficiency are considered. Internal structure optimization and trade-offs may occur in this zone. On the other hand, Pan-Pearl River Delta Economic Zone and Yangtze-River Delta Economic Zone enjoy a more even allocation of quotas.
Similarly, Yi et al. (2011) considered the impact of choice preference on provincial CO2 intensity allocation. In this study, three preferring cases were analyzed. By comparing different choice preference scenarios, we can offer decision makers far more thorough and relevant information.

Fig. 5. Allocation based on different scenarios of equity and efficiency
5.3.2 Different GDP growth
According to Eq. (13), different GDP will incur diverse allocation results. And thus in this part, we study the scenarios where annual growth rate in GDP is set as 4%, 6% and 8%, respectively. Under the three different GDP growth rates, the carbon emission quota allocations are shown in Fig. 6. And some main results can be got as follows.
First, different GDP growth notably and significantly affects increments in carbon quotas. Traditional carbon-emitting provinces (such as Shandong, Hebei, and Jiangsu) receive lower quotas as their GDP growth increases. These lower quotas are a direct result of the provinces’ historically huge accumulated emissions, the high potential to reduce emissions, and the provinces’ poor efficiency.
On the other hand, Fujian, Beijing, Tianjin, and Shanghai are in the completely opposite situation. Their allocated quotas are coordinated to GDP growth. These provinces or municipalities are economically developed and score high in terms of energy efficiency. Their industrial structures are mature, and these areas are evolving as low-carbon economies.
In addition, the overall allocation of quotas changes gradually from uneven to even as GDP grows. When the GDP growth rate remains steady at 4%, the allocation of quotas between provinces and municipalities varies significantly. Provinces such as Shandong receive many quotas, while provinces like Fujian get very few. However, the degree of difference becomes lower when the GDP growth rate holds at 8%. This finding shows that provinces and municipalities will have more closely allocated quotas under higher GDP conditions. This shows a tendency towards more average quotas when rapid and sustainable development is achieved.
Fig. 6. Quota allocations under different GDP growth rates
6.Conclusions and policy implications
6.1 Main conclusions
As China comes closer to having a national CET market, examining the allocation of carbon emission quotas becomes increasingly imperative. In this paper, we investigate China’s east coastal areas as a reference point for regional CET markets and as a guide to form a national market. Primary conclusions emerged from our study are as follows:
First, traditional industrial provinces (such as Shandong and Hebei) warrant lower increments of carbon emission quotas. They have relatively high historically accumulated emissions while low ratings in terms of energy efficiency, and thus these provinces have enormous potential to reduce emissions. For this, those provinces should place a far greater emphasis on their efforts to reduce carbon intensity. On the other hand, areas such as Beijing, Tianjin and Fujian, however, with mature industrial structures and historically low carbon emissions, warrant quotas that actually exceed their CO2 emissions.
When we consider different situations (where either or both equity and efficiency are chosen as variables), Fujian and Guangdong warrant the largest increments in quotas under all scenarios, whereas Shandong and Hebei own the lowest increments. Liaoning does well in efficiency but scores poorly in terms of equity, thereby earning the province a mid-range integrated score.
Third, three different groups emerge when GDP growth rates change. Fujian, Beijing, Tianjin, and Shanghai occupy the first group. Their carbon emission quota shares relate positively to GDP growth. The quota shares of the second group, which includes Shandong, Hebei, and Jiangsu, relate negatively to GDP growth. Exemplified by Guangdong, the allocated quotas in the third group remain almost unchanged, irrespective of GDP growth.
Finally, all the three economic zones covered in our study, have experienced increaseing economic growth, improved energy efficiency, and reduced their carbon emissions during 2005-2014. Specifically, Circum-Bohai Sea Economic Zone has exhibited little in terms of improvement in energy efficiency. The traditional industries in this zone have been the principal generators of carbon emissions for the past decade, and this area has extensive room for improvement. By contrast, Yangtze River Delta Economic Zone has greatly improved its energy efficiency, surpassing the energy efficiency rating of Circum-Bohai Sea Economic Zone since 2012. As for the Pan-Pearl River Delta, which scores high in energy efficiency and low in terms of carbon emissions, it has gradually been allocated quotas that exceed this region’s emissions.
6.2 Policy implications
Allocating carbon quotas is a complex task that requires a comprehensive consideration of social equity and energy efficiency. Decision-makers should integrate and take into account more factors when allocating carbon quotas. For example, a region’s carbon reduction capability, responsibility, potential, and efficiency should all be considered.
In order to achieve faster and more sustainable economic development, an even and equitable allocation of carbon emission quotas among provinces becomes necessary. Our research indicates that the overall allocation of quotas turns from uneven to even as GDP growth increases.
Besides, provinces that reduce energy consumption and emissions should be encouraged economically. More economic support should be offered to provinces like Shandong and Hebei, which are facing heavier burdens in reducing emissions. Industrial transformation and technological reformation are expensive, time-consuming, and resource intensive. China’s central government should offer more support to provinces relying on traditional industries.
Last but not least, regional collaboration is important in terms of reducing carbon emissions at a national level. Therefore, national policies should promote regional cooperation in reducing emissions, alongside the development of an emissions trading market.
Acknowledgements
The paper is partly supported by National Natural Science Foundation of China (Nos. 71402103 and 71521002), Natural Science Foundation of Guangdong Province (No. 2015A030313556), the MOE Youth Foundation Project of Humanities and Social Sciences at Universities in China (No. 13YJC630123) and China Postdoctoral Science Foundation Funded Project (Nos. 2015M580053 and 2016T90042).
【References】
Apergis, N., & Payne, J. E. (2017). Per capita carbon dioxide emissions across U.S. states by sector and fossil fuel source: Evidence from club convergence tests. Energy Economics, 63, 365-372.
Bai, H., Zhang, Y., Wang, H., Huang, Y., & Xu, H. (2014). A hybrid method for provincial scale energy-related carbon emission allocation in China. Environmental science & technology, 48(5), 2541-2550.
Barros, C. P., Managi, S., & Matousek, R. (2012). The technical efficiency of the Japanese banks: non-radial directional performance measurement with undesirable output. Omega, 40(1), 1-8.
Burtraw, D., & McCormack, K. (2017). Consignment auctions of free emissions allowances. Energy Policy, 107, 337-344.
Chang, X., Li, Y., Zhao, Y., Liu, W., & Wu, J. (2017). Effects of carbon permits allocation methods on remanufacturing production decisions. Journal of Cleaner Production, 152, 281-294.
Chen, J., Cheng, S., Song, M., & Wu, Y. (2016). A carbon emissions reduction index: Integrating the volume and allocation of regional emissions. Applied Energy, 184, 1154-1164.
Ciscar, J. C., Saveyn, B., Soria, A., Szabo, L., Van Regemorter, D., & Van Ierland, T. (2013). A comparability analysis of global burden sharing GHG reduction scenarios. Energy Policy, 55, 73-81.
Ekanayake, P., Moriarty, P., & Honnery, D. (2015). Equity and energy in global solutions to climate change. Energy for Sustainable Development, 26, 72-78.
Fujii, H., Managi, S., & Matousek, R. (2014). Indian bank efficiency and productivity changes with undesirable outputs: a disaggregated approach. Journal of Banking & Finance, 38, 41-50.
Gao, C.C., Liu, Y.H., Jin, J., Wei, T.Y., Zhang, J.Y., & Zhu, L.Z. (2016). Driving forces in energy-related carbon dioxide emissions in east and south coastal China: commonality and variations. Journal of Cleaner Production 135, 240-250.
Han, R., Tang, B. J., Fan, J. L., Liu, L. C., & Wei, Y. M. (2016). Integrated weighting approach to carbon emission quotas: an application case of Beijing-Tianjin-Hebei region. Journal of Cleaner Production, 131, 448-459.
International Energy Agency (IEA) (2016). Energy, Climate Change & Environment: 2016 insights. International Energy Agency.
Intergovernmental Panel on Climate Change (IPCC), 2006. IPCC guidelines for national greenhouse gas inventories, IPCC.
Liao, Z., Zhu, X., & Shi, J. (2015). Case study on initial allocation of Shanghai carbon emission trading based on Shapley value. Journal of Cleaner Production, 103, 338-344.
Liu, H., & Lin, B. (2017). Cost-based modelling of optimal emission quota allocation. Journal of Cleaner Production, 149, 472-484.
Liu, L., Chen, C., Zhao, Y., & Zhao, E. (2015). China׳ s carbon-emissions trading: Overview, challenges and future. Renewable and Sustainable Energy Reviews, 49, 254-266.
Mi Z, Meng J, Guan D, Shan Y, Liu Z, Wang Y, Feng K & Wei Y.M. (2017a). Pattern changes in determinants of Chinese emissions. Environmental Research Letters. Doi: 10.1088/1748-9326/aa69cf
Mi, Z., Wei, Y. M., Wang, B., Meng, J., Liu, Z., & Shan, Y., et al. (2017b). Socioeconomic impact assessment of China's CO2 emissions peak prior to 2030. Journal of Cleaner Production, 142, 2227-2236.
Mi, Z., Zhang, Y., Guan, D., Shan, Y., Liu, Z., & Cong, R., et al. (2016). Consumption-based emission accounting for Chinese cities. Applied Energy, 184, 1073-1081.
Miao, Z., Geng, Y., & Sheng, J. (2016). Efficient allocation of CO2 emissions in China: a zero sum gains data envelopment model. Journal of Cleaner Production, 112, 4144-4150.
National Bureau of Statistics of China (NBSC), 2006-2015a. China Statistical Yearbook. China Statistics Press, Beijing.
National Bureau of Statistics of China (NBSC), 2006-2015b. China Energy Statistical Yearbook. China Statistics Press, Beijing.
National Development and Reform Commission—Department of Climate Change (NDRC-DCC). (2014). The People’s Republic of China national greenhouse gas inventory: 2005. China Environmental Press, Beijing.
Pan, X., Teng, F., & Wang, G. (2014). Sharing emission space at an equitable basis: Allocation scheme based on the equal cumulative emission per capita principle. Applied Energy, 113, 1810-1818.
Qin, Q., Li, X., Li, L., Zhen, W., & Wei, Y. M. (2017). Air emissions perspective on energy efficiency: An empirical analysis of China’s coastal areas. Applied Energy, 185, 604-614.
Raupach, M. R., Davis, S. J., Peters, G. P., Andrew, R. M., Canadell, J. G., & Ciais, P., et al. (2014). Sharing a quota on cumulative carbon emissions. Nature Climate Change, 4(10), 873-879.
Ren, J., Bian, Y., Xu, X., & He, P. (2015). Allocation of product-related carbon emission abatement target in a make-to-order supply chain. Computers & Industrial Engineering, 80, 181-194.
Ringius, L., Torvanger, A., & Holtsmark, B. (1998). Can multi-criteria rules fairly distribute climate burdens?: OECD results from three burden sharing rules. Energy Policy, 26(10), 777-793.
Sartor, O., Pallière, C., & Lecourt, S. (2014). Benchmark-based allocations in EU ETS Phase 3: an early assessment. Climate policy, 14(4), 507-524.
Schmidt, R. C., & Heitzig, J. (2014). Carbon leakage: Grandfathering as an incentive device to avert firm relocation. Journal of Environmental Economics and Management, 67(2), 209-223.
Tang, L., Wu, J., Yu, L., & Bao, Q. (2017). Carbon allowance auction design of China's emissions trading scheme: A multi-agent-based approach. Energy Policy, 102, 30-40.
Tokarska, K. B., Gillett, N. P., Weaver, A. J., Arora, V. K., & Eby, M. (2016). The climate response to five trillion tonnes of carbon. Nature climate change 6, 851-855..
Troldborg, M., Heslop, S., & Hough, R. L. (2014). Assessing the sustainability of renewable energy technologies using multi-criteria analysis: Suitability of approach for national-scale assessments and associated uncertainties. Renewable and Sustainable Energy Reviews, 39, 1173-1184.
UNFCCC, 2010. Outcome of the work of the Ad Hoc Working Group on long-term Cooperative Action under the Convention, Home, Cancun Agreements, Draft decision/CP.16.<http://unfccc.int/ files/ meetings/cop_16/ application/pdf/cop16_lca.pdf>
UNFCCC, 2015. China's Intended Nationally Determined Contribution: Enhanced Actions on Climate Change. http://www4.unfccc.int/submissions /INDC/Submission Pages/Submissions.aspx.
Vaillancourt, K., & Waaub, J. P. (2004). Equity in international greenhouse gases abatement scenarios: A multicriteria approach. European Journal of Operational Research, 153(2), 489-505.
Wang, J. J., Jing, Y. Y., Zhang, C. F., & Zhao, J. H. (2009). Review on multi-criteria decision analysis aid in sustainable energy decision-making. Renewable and Sustainable Energy Reviews, 13(9), 2263-2278.
Wang, K., Zhang, X., Wei, Y. M., & Yu, S. (2013). Regional allocation of CO2 emissions allowance over provinces in China by 2020. Energy Policy, 54, 214-229.
Wang, X., Cai, Y., Xu, Y., Zhao, H., & Chen, J. (2014). Optimal strategies for carbon reduction at dual levels in China based on a hybrid nonlinear grey-prediction and quota-allocation model. Journal of Cleaner Production, 83, 185-193.
Wei, C., Ni, J., & Du, L. (2012). Regional allocation of carbon dioxide abatement in China. China Economic Review, 23(3), 552-565.
Xiong, L., Shen, B., Qi, S., Price, L., & Ye, B. (2017). The allowance mechanism of China’s carbon trading pilots: A comparative analysis with schemes in EU and California. Applied Energy, 185, 1849-1859.
Yi, W. J., Zou, L. L., Guo, J., Wang, K., & Wei, Y. M. (2011). How can China reach its CO2 intensity reduction targets by 2020? A regional allocation based on equity and development. Energy Policy, 39(5), 2407-2415.
Yu, S., Wei, Y. M., Fan, J., Zhang, X., & Wang, K. (2012). Exploring the regional characteristics of inter-provincial CO2 emissions in China: an improved fuzzy clustering analysis based on particle swarm optimization. Applied energy, 92, 552-562.
Yu, S., Wei, Y. M., & Wang, K. (2014). Provincial allocation of carbon emission reduction targets in China: an approach based on improved fuzzy cluster and Shapley value decomposition. Energy Policy, 66, 630-644.
Zetterberg, L., Wråke, M., Sterner, T., Fischer, C., & Burtraw, D. (2012). Short-run allocation of emissions allowances and long-term goals for climate policy. Ambio, 41(1), 23-32.
Zhang, C., Wang, Q., Shi, D., Li, P., & Cai, W. (2016). Scenario-based potential effects of carbon trading in China: An integrated approach. Applied Energy, 182, 177-190.
Zhang, J., Wu, G., & Zhang, J. (2004). Estimating China’s provincial capital stock: 1952-2000. Economic Research Journal, 10, 35-42 (in Chinese).
Zhang, S.H., & Jiang, W.J. (2016). Energy efficiency measures: comparative analysis. The Journal of Quantitative & Technical Economics 7, 3–24 (in Chinese).
Zhang, Y. J., & Hao, J. F. (2016). Carbon emission quota allocation among China’s industrial sectors based on the equity and efficiency principles. Annals of Operations Research, 1-24.
Zhang, Y. J., Wang, A. D., & Da, Y. B. (2014). Regional allocation of carbon emission quotas in China: Evidence from the Shapley value method. Energy Policy, 74, 454-464.
Zhang, Y. J., Wang, A. D., & Tan, W. (2015). The impact of China's carbon allowance allocation rules on the product prices and emission reduction behaviors of ETS-covered enterprises. Energy Policy, 86, 176-185.
Zhao, R., Min, N., Geng, Y., & He, Y. (2017). Allocation of carbon emissions among industries/sectors: An emissions intensity reduction constrained approach. Journal of Cleaner Production, 142, 3083-3094.
Zhou, P., Ang, B. W., & Wang, H. (2012). Energy and CO2 emission performance in electricity generation: a non-radial directional distance function approach. European Journal of Operational Research, 221(3), 625-635.
Zhou, P., & Wang, M. (2016). Carbon dioxide emissions allocation: a review. Ecological Economics, 125, 47-59.
Zhou, P., Zhang, L., Zhou, D. Q., & Xia, W. J. (2013). Modeling economic performance of interprovincial CO2 emission reduction quota trading in China. Applied Energy, 112, 1518-1528.